
October 5, 2026 · 17 min read
How to build a competitive ad intelligence dashboard for clients
Build a competitive ad intelligence dashboard clients actually read, from the four tiles that matter to the delivery checklist agencies skip. 2026 guide.
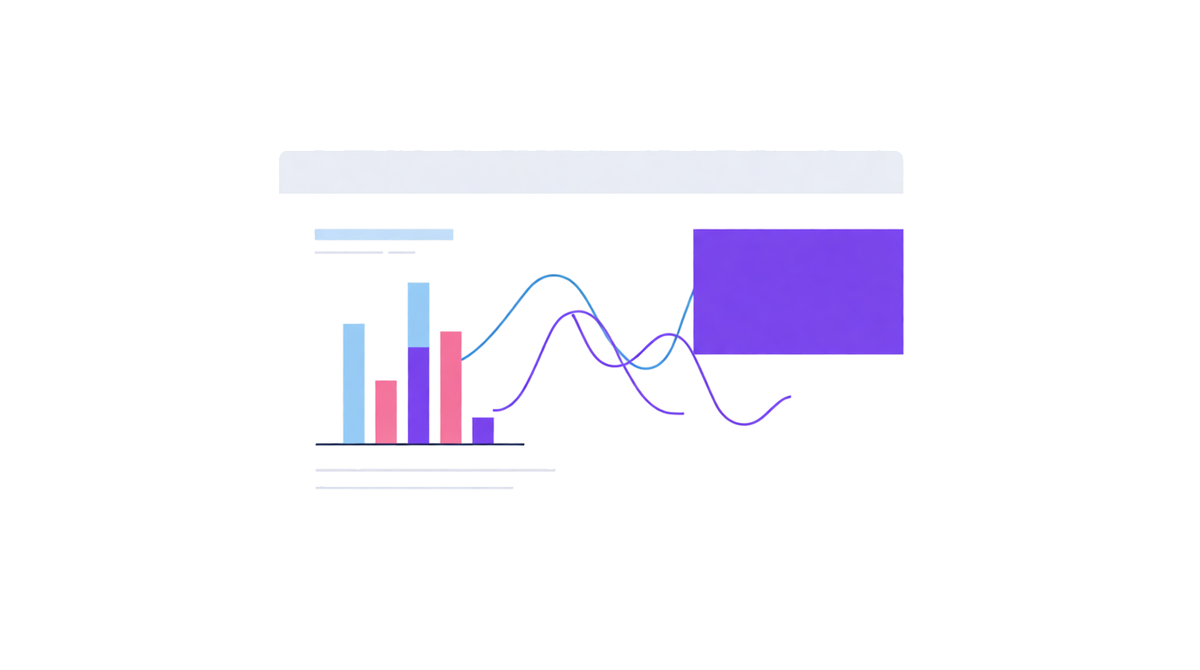
A competitor ad tracking dashboard has four layers: collection from ad libraries and APIs, normalization into one schema, storage that keeps history, and a presentation layer built for the people reading it. The architecture carries the value, not the charting tool, because a dashboard fed by manual exports goes stale within a week.
A client asks a simple question: "what are our competitors doing with their ads right now?" If you have to open five different tools, export three CSVs, and spend an afternoon in a spreadsheet, the answer arrives too late. The client has already made a decision without your data.
A competitive ad intelligence dashboard solves this. It pulls competitor ad data from multiple sources into one view that updates on a schedule. When the client asks, you open a link instead of scrambling for screenshots. This guide covers how to build one, whether you are a solo founder running paid acquisition or an agency managing ad strategy for multiple accounts.
What belongs in a competitive ad intelligence dashboard
Most dashboards fail because they try to show everything. A client does not need to see every ad your competitor has ever run. They need to see the signals that matter for decisions: where competitors spend, what they say, and whether it is working.
Start with these four sections. Everything else is noise.
Competitor spend and channel split. Show which channels each competitor invests in: search, social, display, and video. Use colored bars or a simple stacked chart. Include trend lines so the client can see if a competitor is ramping up or pulling back. Spend estimates do not need to be exact. Direction and relative weight are what drive decisions.
Creative library with performance tags. A scrolling gallery of competitor ads with tags: active, paused, winning, testing. Group by format (video, static, carousel) and theme (price-focused, feature-led, testimonial). Clients care about what the competitor is saying, not just that they are spending. A well-tagged creative library answers "what are they testing right now?" in five seconds.
Share of voice tracker. A single number or gauge showing what percentage of total ad impressions in the category belongs to each competitor. Include your own brand so the client sees the full picture. Share of voice is the metric that makes competitive intelligence feel real to decision makers. It turns "they are running ads" into "they own 40% of the conversation."
Weekly change log. A simple table showing what changed this week: new creatives launched, old creatives paused, budget shifts, new channels entered. This is the section clients read first. It answers the only question they care about: "what happened while I was not looking?"
Where the data comes from
You cannot build a dashboard without data sources. The good news: most competitive ad data is publicly visible. You just need the right pipes to collect it.
Meta Ad Library and TikTok Ad Library are free and official. They show every active ad from any brand, with start dates and platform metadata. The limitation: they do not expose spend data or performance metrics. You get creative visibility, not competitive benchmarking.
Google Ads Transparency Center shows search and display ads from verified advertisers. It covers ad copy, formats, and the regions where ads ran over the past 30 days. Useful for keyword-level competitive intelligence but limited to Google's ecosystem.
Paid ad intelligence tools fill the gaps that free sources leave open. Tools like adextract aggregate competitor ads across Meta, TikTok, Google, LinkedIn, and YouTube into a single feed. They add spend estimates, impression data, and trend analysis that you cannot get from ad libraries alone. For a dashboard that actually answers client questions, a paid tool is the difference between an art gallery and an intelligence report.
The best setup combines free and paid sources. Use ad libraries for creative verification and timestamp accuracy. Use a tool like adextract for spend estimates, cross-platform aggregation, and automated monitoring. The free sources validate the paid data. The paid sources make the free data actionable.
How to structure the dashboard for different audiences
Not every client reads a dashboard the same way. A founder wants the top-line signal. A performance marketer wants the granular data. A CMO wants the narrative. Build one dashboard with three views, not three separate dashboards.
The executive view shows one number and one chart. Share of voice trend over the last 90 days, with a single sentence of interpretation: "Competitor X gained 8 share points this quarter, driven by a 3x increase in TikTok spend." The executive should absorb the dashboard in under 30 seconds.
The operator view shows the full competitive landscape. Spend estimates by channel and competitor, creative gallery with tags, keyword overlap analysis, and the weekly change log. This is where the performance marketer or media buyer spends their time. They are looking for tactical signals: which keywords to bid on, which creative formats to test, which channels are getting crowded.
The narrative view is what you present in a client meeting. It is a slide or a single page that tells a story: here is what the market did this month, here is what it means, here is what we recommend. The data backs the story. The story makes the data worth the client's time.
Tools to build and host the dashboard
You do not need a custom development project to get a dashboard live. The tools already exist. What matters is picking the right combination for your budget and technical comfort.
Google Looker Studio is free and connects to Google Sheets, BigQuery, and most ad platforms. It is the default choice for agencies that need to deliver clean, branded reports without writing code. The tradeoff: data refresh frequency depends on your connectors, and real-time updates require paid middleware.
Notion or Airtable dashboards work well for founder-led teams. They are quick to set up, easy to share with clients via a link, and flexible enough to include commentary alongside data. The limitation: they are manual to maintain unless you connect them to an API via Zapier or Make.
Custom dashboards built with Retool, Streamlit, or a simple React app give you full control. If you have engineering resources or you are building this as a product feature for your agency, a custom dashboard lets you design exactly the views your clients need. The setup cost is higher, but the long-term flexibility pays off if you are managing more than five client accounts.
The data pipeline matters more than the visualization layer. A pretty dashboard fed by stale data is worse than a plain spreadsheet that updates daily. Before you invest in design, make sure your data refresh cadence matches what the client expects. Weekly refreshes are the minimum. Daily or real-time is ideal for brands in competitive, fast-moving categories.
Automating the data pipeline
Manual data collection does not scale past two clients. You will spend more time exporting CSVs than analyzing insights. Automation is what turns a dashboard from a project into a service.
The simplest automation stack: an ad intelligence API that pushes competitor data into a Google Sheet on a schedule, Looker Studio reading from that sheet, and a Slack or email notification when significant changes are detected. This is a weekend project for a technical founder and a 20-hour setup for an agency with a data analyst.
For teams that want deeper automation, MCP servers can connect ad intelligence data directly to AI agents. An MCP server like adextract's lets an AI agent pull competitor ad data, generate weekly summaries, and even draft client-ready commentary automatically. This is the approach detailed in our guide to building an MCP-powered competitive ad intelligence stack. The agent does the data gathering. You do the strategic interpretation.
What to charge for a competitive intelligence dashboard
Agencies typically charge competitive intelligence as an add-on to media buying retainers, not as a standalone product. The dashboard itself is not the value. The value is the interpretation and the speed of decision making.
For solo founders or small agencies just starting to offer this service, here is what the market supports:
A competitive intelligence add-on to an existing media buying retainer typically adds $500 to $1,500 per month per client. This covers the dashboard, weekly updates, and a monthly strategy call where you interpret the data and recommend actions.
A standalone competitive intelligence report delivered monthly without media buying runs $1,000 to $3,000. This works well for brands that handle media buying in-house but want an external view of the competitive landscape.
The pricing model that scales best is a flat monthly fee per competitor tracked. For example: $500 per month for up to three competitors, $200 for each additional competitor. This aligns your revenue with the scope of work and makes pricing transparent for the client. If they want to track eight competitors instead of three, the price adjusts naturally.
Do not charge by data volume. No client cares how many rows of data you processed. Charge by insight. The dashboard is the delivery mechanism. The decisions it enables are what the client pays for.
Common mistakes that make dashboards useless
Even well-built dashboards fail when they violate a few simple rules. Here are the three mistakes that kill competitive intelligence dashboards, based on what we have seen working with agencies and performance teams.
Too many competitors tracked at once. A dashboard tracking 15 competitors is a data firehose, not a decision tool. Limit to three to five direct competitors. If the client insists on tracking more, group the extras into a secondary "market landscape" view that updates less frequently. The primary view stays focused on the competitors that actually threaten the client's revenue.
Data without interpretation. Sending a client a dashboard link with no context is like handing someone a blood test result with no doctor. The numbers mean nothing without the story. Every dashboard delivery should include at minimum a three-sentence summary: what changed, why it matters, what we should do about it.
Stale data that erodes trust. The fastest way to lose a client is to present last month's data as current intelligence. If your dashboard cannot refresh at least weekly, tell the client upfront and set expectations. Better to deliver a simple weekly PDF with last week's data than a fancy real-time dashboard that has not updated in three weeks. If you are just starting with competitive intelligence, our founder's guide to ad intelligence covers the cadence and scope that works for teams with limited time and budget.
A good dashboard is a decision accelerator. It shrinks the time between "what are competitors doing" and "here is what we are going to do about it." Build it once, automate the data, and spend your time on the part that clients actually pay for: the interpretation.
The 2026 competitive ad intelligence landscape
The tool market split into two clear categories this year. Ad spy tools like Foreplay, SocialPeta, and AdClarity build searchable databases of competitor ads from public libraries. They answer one question: what are competitors running. Creative intelligence platforms like Hawky, Motion, and MagicBrief analyze ad performance at the element level and connect hooks, visuals, and CTAs to outcomes like ROAS.
The bigger shift is agentic automation. Leading tools no longer surface insights in a dashboard and wait for a human. They run scheduled analyses, flag creative fatigue before performance drops, and route tasks to the right team member automatically. The category moved from reporting tool to operating system.
Element-level analysis is the new standard. Instead of ad-level metrics, tools break every creative into components: hook style, visual hierarchy, emotional triggers, CTA placement. Each gets its own performance score, which turns one-off creative wins into repeatable systems.
Consolidation is the third force. Teams want fewer tools that do more, and MCP endpoints are becoming a checklist item in tool evaluations. A dashboard that also exposes its data to an AI agent is increasingly the default ask, which is why the automation section in this guide matters more than ever.
September 2026 update: dashboards are becoming agent-readable
The dashboard pattern from the guide above still works, but client expectations moved in one direction: they want the underlying data reachable by their own AI tools, not just rendered as charts. A dashboard that is also a data layer, one an agent can query, is becoming the default ask.
The practical version: keep the Looker Studio or Notion view for humans, and add an MCP or API feed for the machine layer. Our guide to AI agents for competitor ad intelligence shows how that machine layer turns a static dashboard into a weekly briefing generator.
The weekly change log remains the section clients read first, and it is now the easiest to automate. Spend estimates and creative refresh signals feed the log automatically, and the interpretation stays human: what changed, why it matters, what we recommend.
Share of voice is still the headline metric, but the September shift is that it can now be estimated across platforms rather than measured inside a single ad library. Directional is fine for decision making, and it beats showing no number at all.
For agencies running this for multiple clients, the adextract MCP server removes the manual export step from the weekly refresh. The agent collects the data, the dashboard renders it, and the team spends its time on the monthly strategy call instead of the CSV cleanup.
Pricing guidance from the original post still holds. The flat monthly fee per competitor tracked scales best, and clients increasingly expect the add-on to include a written summary their own tools can ingest. Charge for the interpretation, deliver the data in a form that travels.
A pre-delivery checklist for every client dashboard
Building the dashboard is the easy half. Keeping it trustworthy across dozens of deliveries is where agencies lose accounts. Run this checklist before any client link goes out.
Every number carries a source line. A tile showing a competitor spend estimate needs to say where the figure came from and when it was pulled. Clients forgive an approximate number with a visible source. They do not forgive a precise number with no provenance.
The change log is not empty. If the weekly log has no entries for two consecutive weeks, assume the pipeline broke rather than assuming the market went quiet. Competitors rarely stop shipping creative at the same time.
Share of voice adds up. The shares across tracked brands plus your client should land near 100 percent. If they sum to 240 percent, you are mixing platforms that count impressions differently and the headline number is fiction.
Tiles nobody opened get deleted. Check the dashboard view analytics once a month. A tile that has not been opened in 30 days is decoration, and decoration makes the whole page read as a data dump.
The phone view works. Most founders open the link on a phone between meetings. If the executive tile needs horizontal scrolling to read, it will not get read.
Each client link is scoped. One shared link across every account is the fastest way to leak a competitor list between clients. Issue per-client views, and revoke access the week an engagement ends.
If the manual collection step is what keeps you from hitting this checklist, automate that layer first. Our guide to setting up ad monitoring for your brand covers the schedule and the alert thresholds, and the MCP-powered competitive ad intelligence stack shows how to hand the collection step to an agent.
The checklist is unglamorous work, and it is the reason clients renew instead of shopping the dashboard around every quarter.
How often should a competitor ad tracking dashboard refresh?
Weekly at minimum, and daily in categories where competitors launch creative fast. The refresh interval is the architecture decision that decides whether anyone opens the dashboard a second time, because a client who finds the same numbers two weeks running stops trusting the tile.
Expectations have moved that way across the wider discipline. The State of Competitive Intelligence 2026 report from Segment8, built on a study of more than 600 organizations, found that the share of programs producing real-time alerts rose from 19% in 2023 to 64% in 2026, while the share producing only quarterly outputs fell from 44% to 12%.
For an agency dashboard the practical version is a scheduled pull into storage, then a view that reads from storage instead of from a live query. Our guide on how to set up ad monitoring for your brand covers what is worth scheduling first, and an MCP server layer that removes the export step entirely so the refresh runs without anyone opening a browser.
What should a client dashboard show before anything else?
The weekly change log. Clients act on differences, not on a spend estimate that has sat at the same number for three weeks. Lead every delivery with what moved, then let the spend and share of voice tiles support it.
Two habits keep that log usable. Write each entry as one line with a date and a source, and never let the log run empty for two weeks in a row, because an empty log almost always means the pipeline broke rather than that nothing changed.
Share of voice still belongs near the top as the single headline number, and it is the metric clients quote back to their own leadership. Our guide to the ad monitoring metrics and KPIs worth reporting covers the rest of the short list, and the pre-delivery checklist in this guide keeps those numbers defensible once they are in front of a client.
One last architecture note: keep the collection layer separate from the presentation layer even for a single client. When the two are tangled, changing a chart means touching the pipeline, and agencies stop iterating on a dashboard the moment every tweak carries delivery risk.
What changed in competitive ad intelligence dashboards in 2026
The dashboard moved from a reporting artefact to a subscription product, and the numbers behind that shift come from the Crayon 2026 State of Competitive Intelligence report. Two-thirds of teams now run a dedicated competitive intelligence platform, up from roughly a third in 2022, and 80% use AI to generate sales-facing competitive content, up from 61% in 2025.
Agents are the newer change. Half of the teams in that survey now run AI agents in production or pilot, with another 14% planning to within a year, and the teams running them report revenue impact at 82% against 42% for teams that do not. For an agency, that is the argument for selling the dashboard as an always-on service rather than a monthly PDF.
Delivery expectations moved with it. The same report found teams that share competitive intel weekly or faster achieve revenue impact at 79%, against 41% for teams on a monthly or slower cadence, which is why the refresh interval is now the feature clients ask about first.
How do you prove a client dashboard earned its renewal?
Track the decisions, not the pageviews. A renewal argument built on open rates loses to one built on outcomes, so log every time the dashboard changed a decision: a new creative angle briefed, a bid range adjusted, a competitor launch caught early.
Give each entry a date, a one-line decision, and the tile that triggered it. Four or five of those across a quarter is a stronger renewal case than any usage chart, because it answers the only question the client's finance team asks, which is what the subscription produced.
Run the same log against the abandoned tiles. A tile nobody opened in 30 days is decoration, and deleting it is a renewal argument too, because a shorter dashboard reads as editing rather than accumulating.
Close the loop in the quarterly review by replaying the log in order. Our guide to the ad monitoring metrics and KPIs worth reporting covers which numbers to attach to each entry, and the workflows small agency teams use show how to keep the log current without adding a second job.
A 30-day onboarding plan for a new client dashboard
Week one is scoping, not building. Agree the competitor set at three to eight brands, agree which decisions the dashboard is meant to support, and write both down, because a dashboard scoped to every competitor answers no question in particular.
Week two is the collection layer. Stand up the scheduled pull from the ad libraries and APIs before any charting happens, and confirm two consecutive successful runs, because a dashboard that has never refreshed twice is a mockup.
Week three is the presentation layer and the change log. Build the weekly difference view first, add the share of voice tile second, and leave vanity tiles out until the client asks for one by name.
Week four is handover. Walk the client through the change log, the refresh cadence, and the access model, then schedule the first monthly review before you close the kickoff call. Our guide to setting up ad monitoring for your brand covers the alert thresholds that make the difference view useful, and the pre-delivery checklist in this guide is the gate to clear before the link goes out.
Frequently asked questions
How often should a competitive ad intelligence dashboard be updated?
Weekly is the minimum for most clients. For brands in fast-moving categories like ecommerce or gaming, daily updates are worth the investment. The key is consistency: a dashboard that updates reliably every Monday is more trusted than one that claims to be real-time but goes silent for two weeks.
What is the cheapest way to build a competitive ad intelligence dashboard?
A Google Looker Studio dashboard connected to a Google Sheet that you manually update from free ad libraries (Meta Ad Library, TikTok Ad Library, Google Ads Transparency Center). Total cost is zero dollars, but the time investment is roughly two to three hours per week per client for manual data collection and entry.
How many competitors should a dashboard track?
Three to five direct competitors for the primary view. More than five and the dashboard becomes cluttered and hard to interpret. If you need to track additional competitors, create a secondary market landscape view that updates monthly rather than weekly.
Can I build a competitive intelligence dashboard without coding?
Yes. Google Looker Studio, Notion, and Airtable all support no-code dashboard creation. Pair them with an ad intelligence tool that exports data to Google Sheets or CSV and you can have a functional dashboard without writing any code. The tradeoff is that manual data refreshes take more time as you add clients.
What metrics should a competitive ad intelligence dashboard include?
At minimum: competitor spend estimates by channel, share of voice trend, a creative library with format and theme tags, and a weekly change log showing what is new, paused, or changed. Avoid vanity metrics like total ad count. Focus on metrics that answer the question 'what should we do differently?'